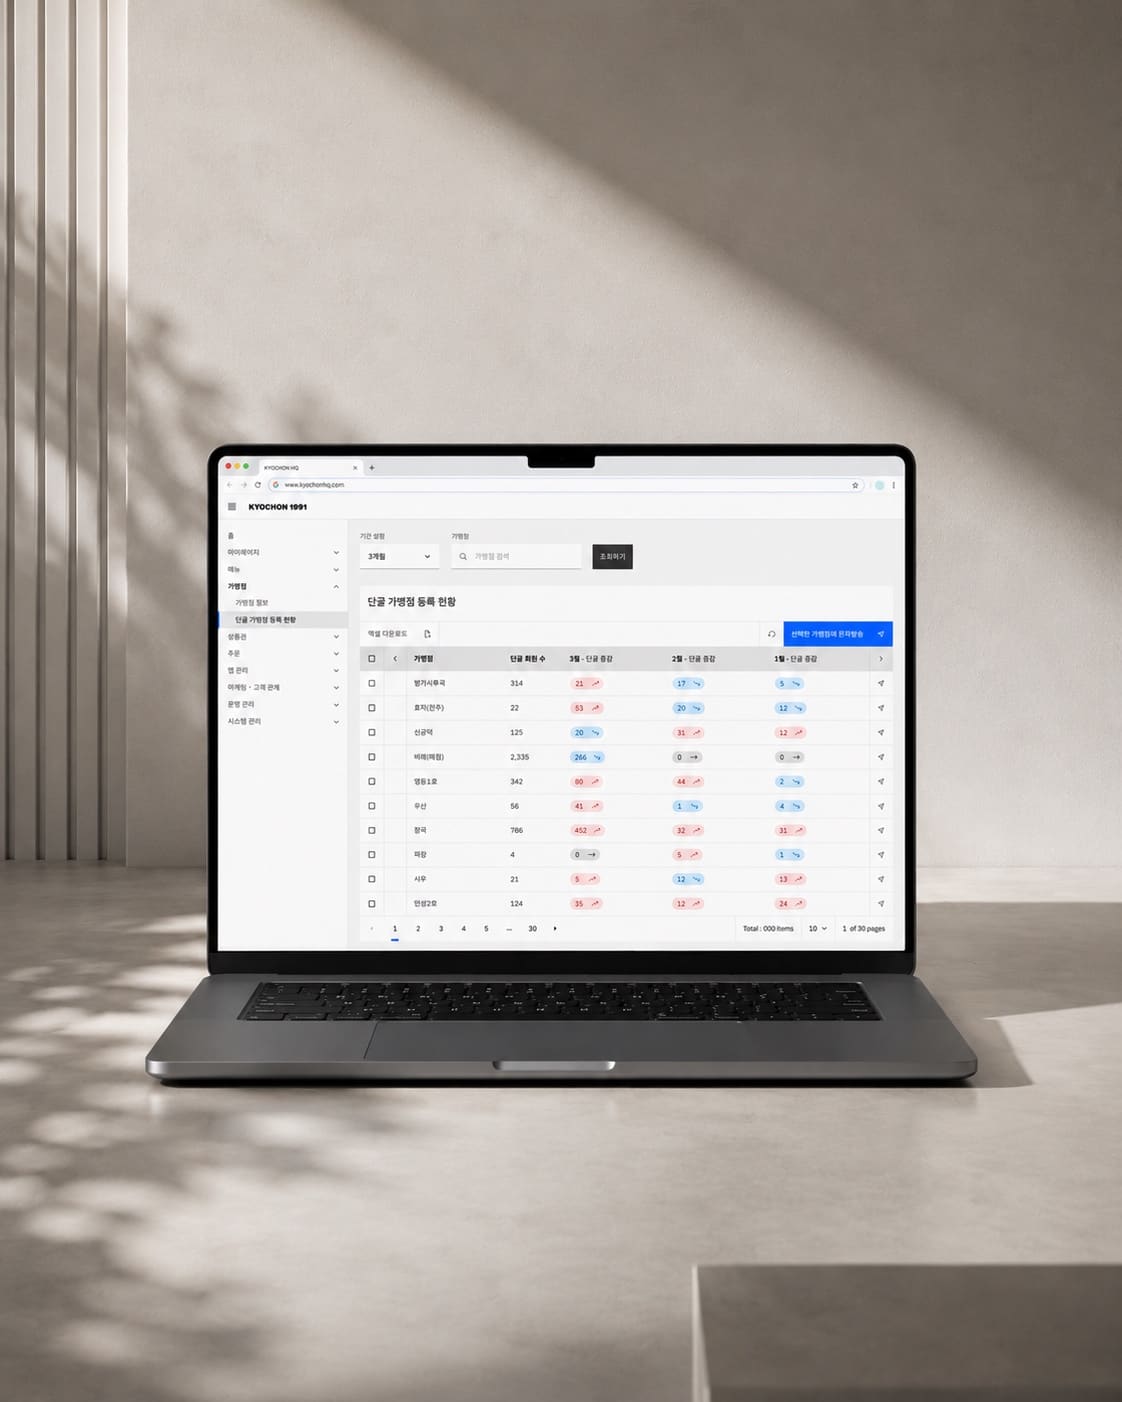
A web console for the KYOCHON head office. Stores, gift cards, orders, app management, marketing, operations and system settings sit under one left-hand navigation, and most screens are a set of query conditions above a table.
Don't build a screen that ends at "found it"
Operations tools usually end the same way: you run the query, export to Excel, then open something else to actually do the thing. Context breaks in that gap, and the action slides to tomorrow. So the action moved into the table — tick the stores, hit send, and the response finishes where the problem was found. Excel export stays, but as the fallback route, not the main one.
One number tells you nothing
A regulars count on its own can't say whether a store is doing well. So each row carries the last three months of movement next to it. A store with 2,335 members falling three months straight and a store with 21 members climbing are entirely different cases — the table shows that difference in a single line.
Direction first, magnitude second
Movement is read as color and arrow before it's read as a number: red for up, blue for down, grey for no change. That's the convention this market already reads by, so there was no reason to insist on the international one (green for up) here. Using a rule people already have beats teaching them a new one.
Conditions above, results below
Period and store search are pinned in one row above the table. Keeping the query next to its result is what lets someone distrust a strange number and re-run it immediately.
Finish the job on the screen where you found it.